DFIH — Data for Financial History
A comprehensive database on the French stock markets since 1795
Learn moreThe DFIH database collects data on firms and securities prices listed on the Paris stock exchange from 1795 to 1976. The database is still under construction , and more data will be added continuously.
The open data available on this site is as close as possible to the primary sources (see details on the Wiki ).
Further services will also be added for registered users, which will permit the downloading of specified samples of cleaned data and of long term series, as well as for the construction of tailored indices. Please fill the following form to create your account .
In the sections below, you can find some statistics that give a first idea of what can be found on DFIH. If you want to access the data directly, please use the Stock exchanges , Issuers and Persons buttons above.
We hope you will enjoy DFIH. We look forward to your comments and contributions.
Number of issuers listed
For each year, this graph plots the total number of private companies or of public authorities (either French or foreign), whose securities are listed on the official Paris stock exchange (between 1795 and 1976) or the unofficial Coulisse (between 1873 and 1898), at any given moment of the year.
Graph loading. Please wait...
Age of listed companies
This graph plots the age (from foundation) of all companies listed on the official Paris stock exchange in a given year.
Graph loading. Please wait...

Age of companies at the time of their initial listings on the official stock exchange
Graph loading. Please wait...
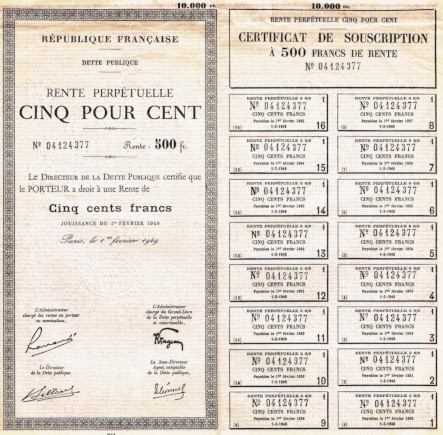
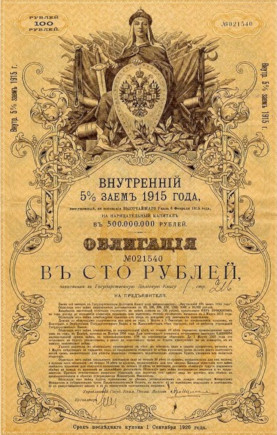
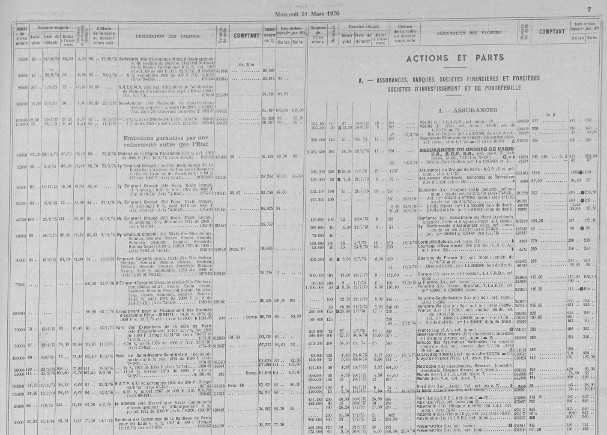
Nominal value of foreign government and colonial bonds listed on the Paris Stock Exchange


Listing duration
For each corporation listed on the official stock exchange between 1799 and 1976, this graph draws a line from the day it is first listed to the day it disappears from the official list. For a number of companies, the last date is currently under investigation and we show the line as ending in 1952 (the last date of the prices in the database).
Graph loading. Please wait...
- Up to 2405 shares listed (in 1967)
- Up to 930 public bonds listed (in 1938)
- Up to 1812 private bonds (in 1967)
Securities listed
This graph plots the total number of securities appearing during a given year on the list of the official stock exchange, distinguishing between private companies' shares, private bonds and securities issued by public authorities.
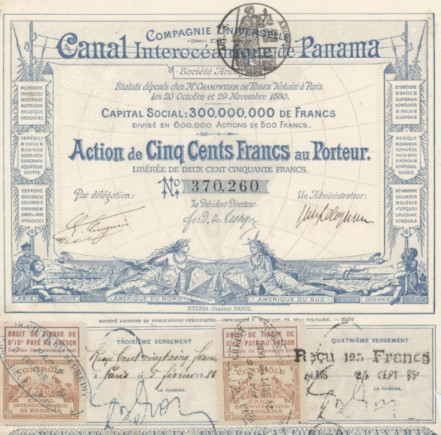
French and foreign securities
For every private company with known headquarter location(s), this graph plots the number of shares and bonds appearing during a given year on the official stock exchange list, with a distinction made between French and foreign companies.
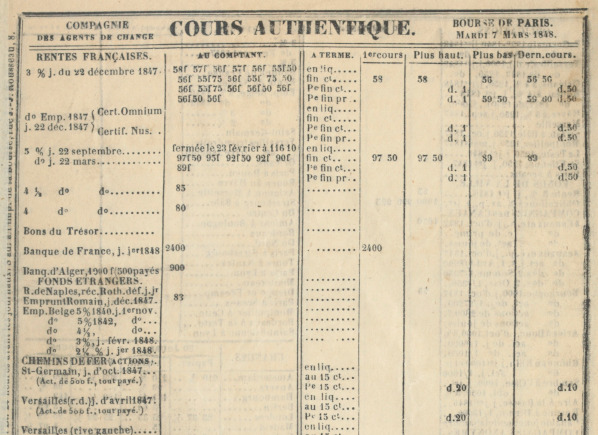
Price observations
This graph plots the total number of prices observed on the official stock exchange during the 24 days per year for which data has been collected for the DFIH database.
Price observations per security liquidity: from zero to 45 prices a day
This graph plots the average number of prices per security observed on the official stock exchange during the 24 days per year for which data has been collected for the DFIH database.
Persons
This graph plots, for every yearbook processed, the total number of corporations, administrators and positions mentionned. It also gives the average number of administrator per corporation, as well as the average number of positions occupied by an administrator.
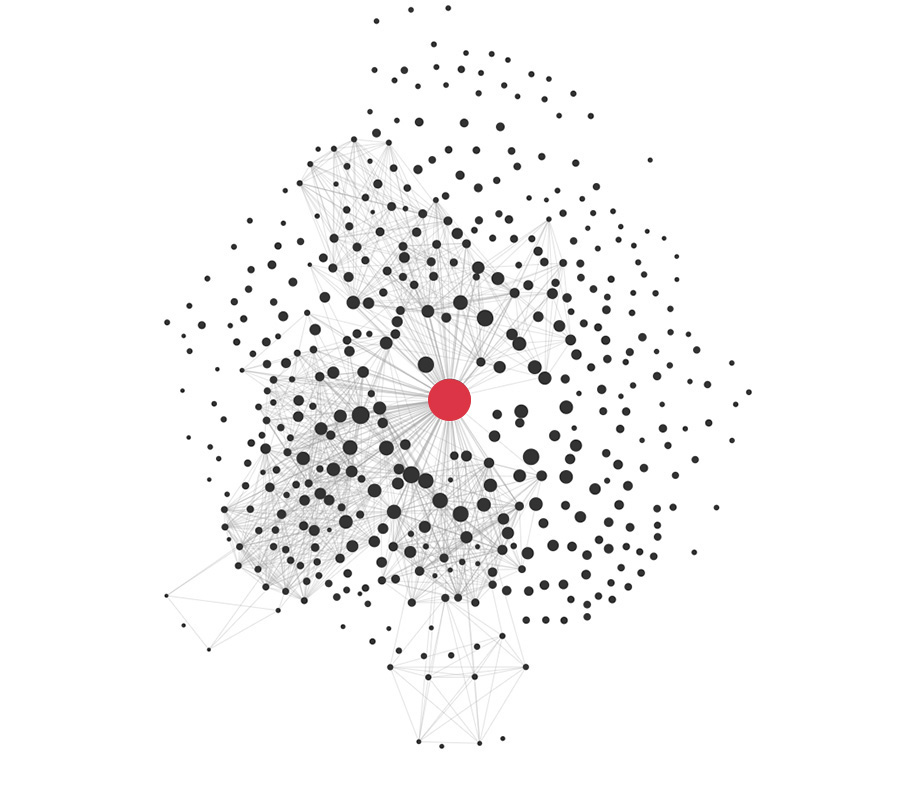
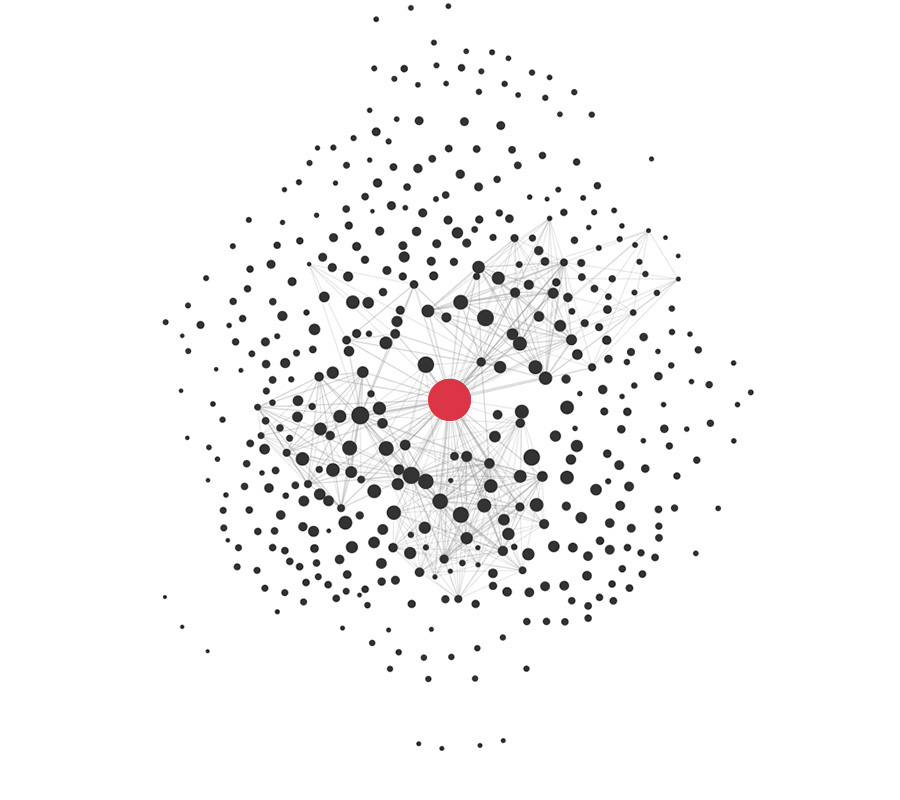
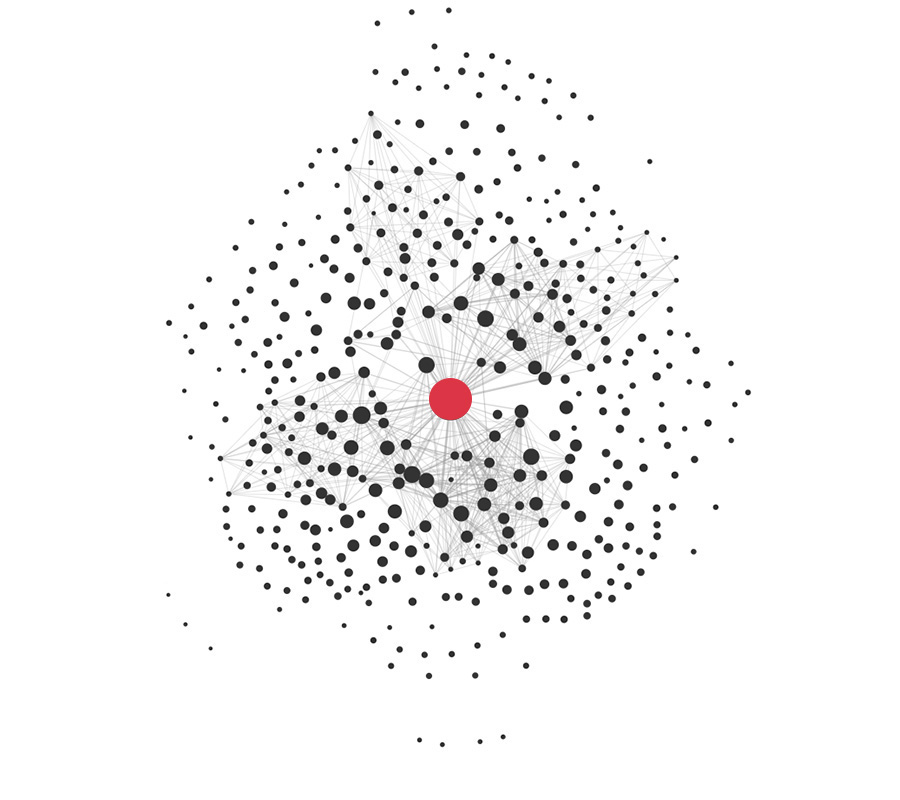
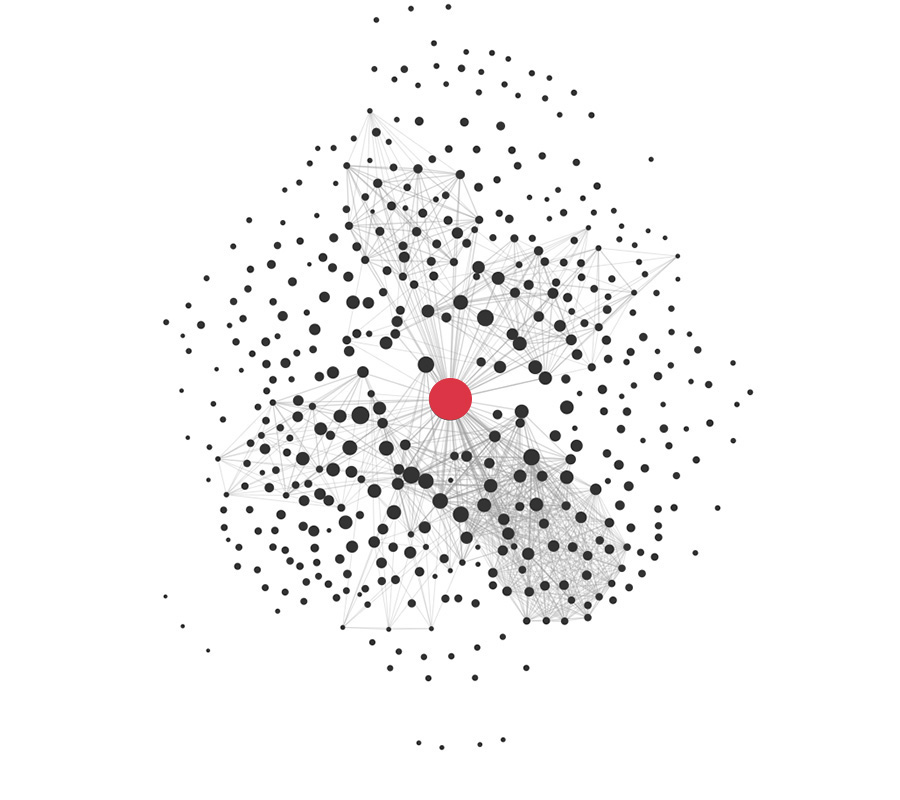
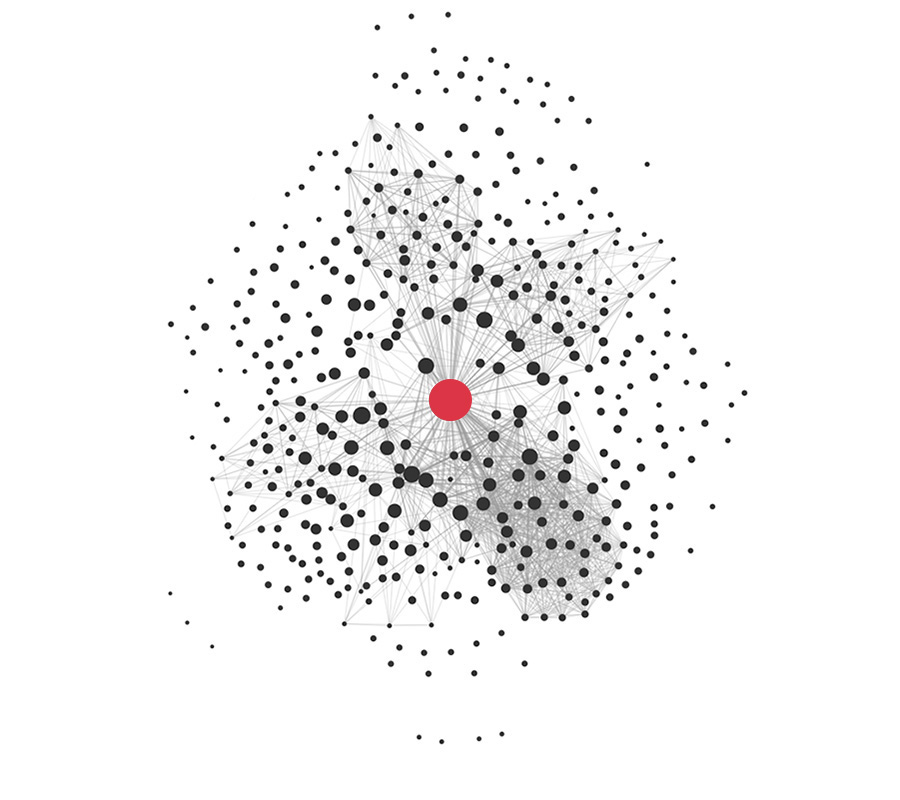
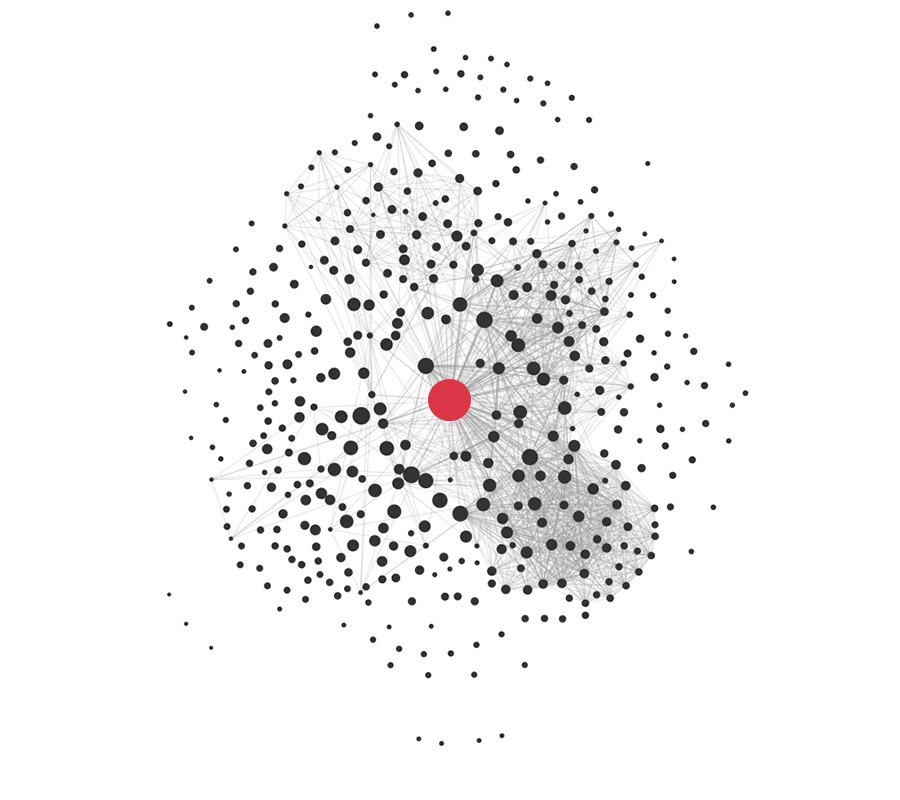
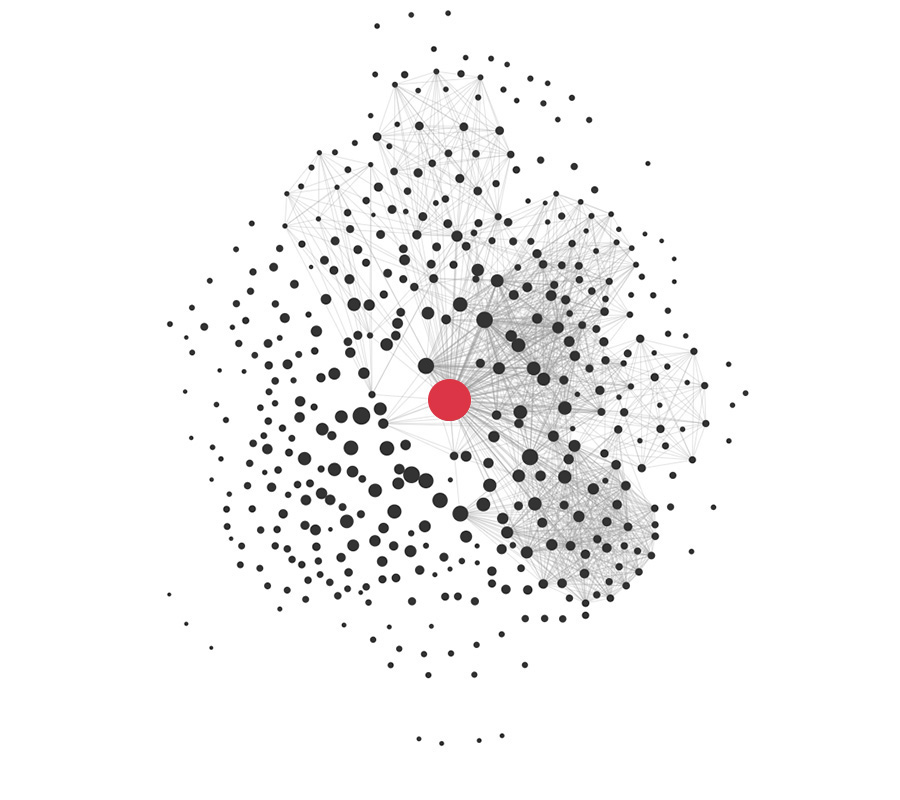
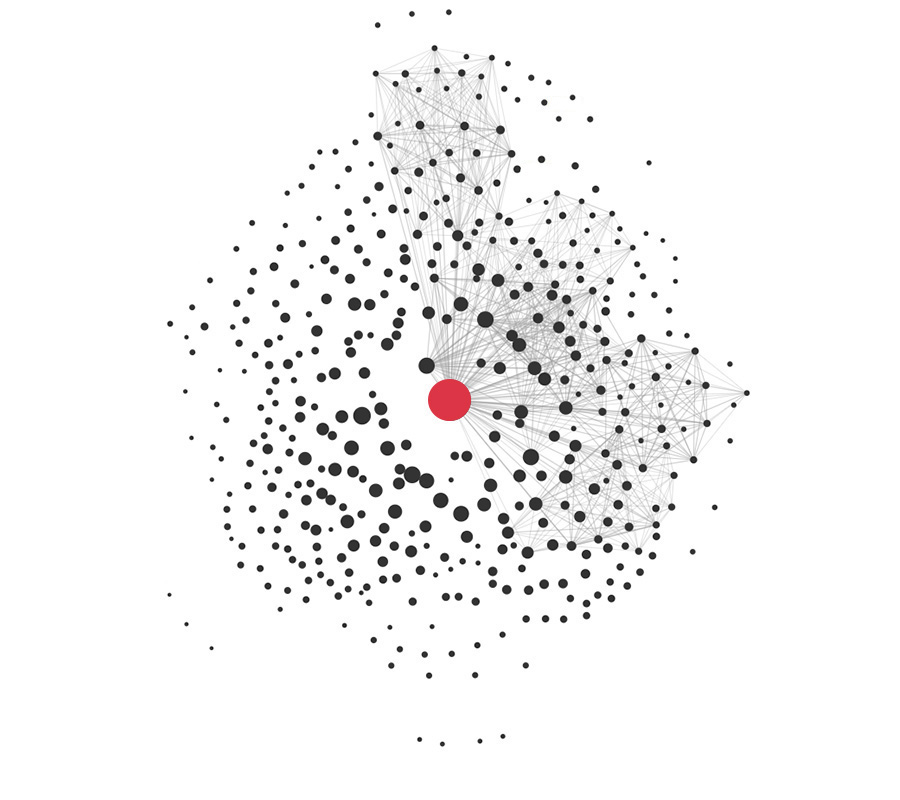
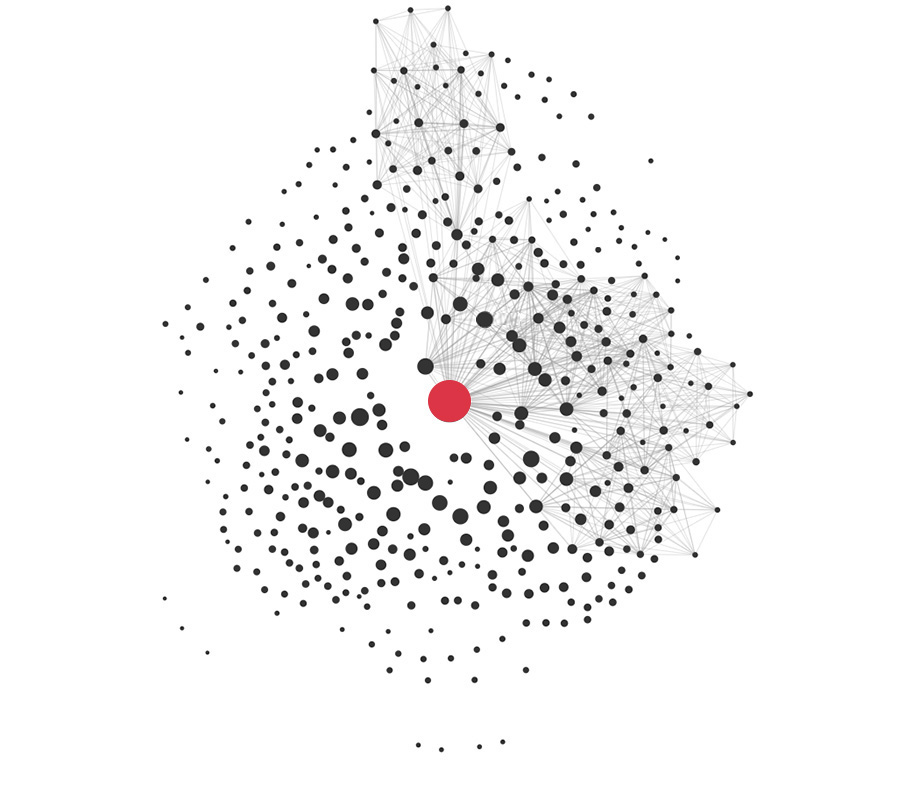
Ego centered network of baron Léon de Nervo (1873-1973)
Each tie represents the co-presence in a company Board and, more specifically, the network shows all nodes to whom Nervo has a connection from 1912 to 1953, i.e. the period in which he appeared in the yearbooks treated. The graph shows its connections as well as the connections among the persons to which he is connected.
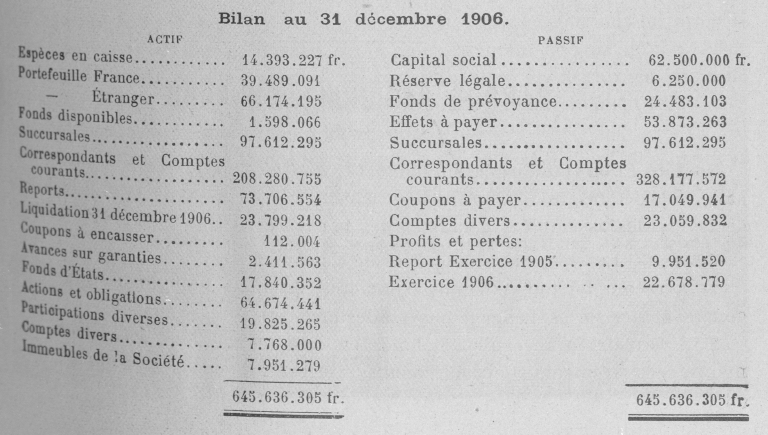
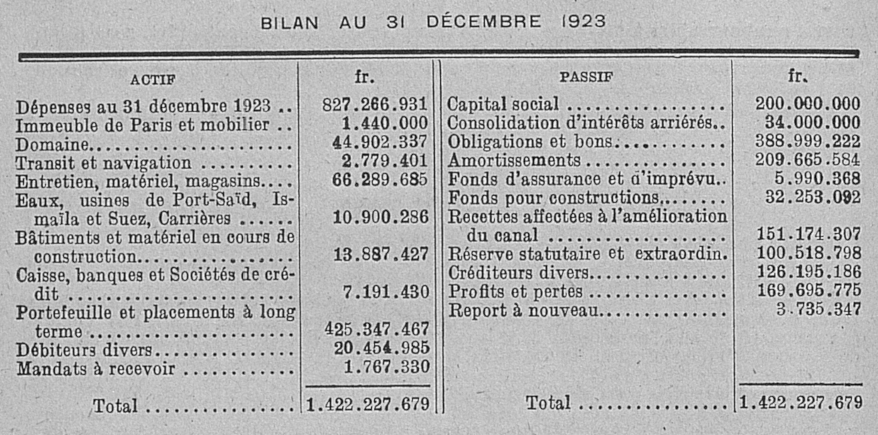
Balance Sheets
This graph plots the number of balance sheets in the DFIH database, distinguishing between balance sheets of companies listed on the official stock exchange at the date of the balance sheet; and those of companies which are either listed on the unofficial Coulisse, or listed on regional stock exchanges, or are not yet listed.
Materials price observations
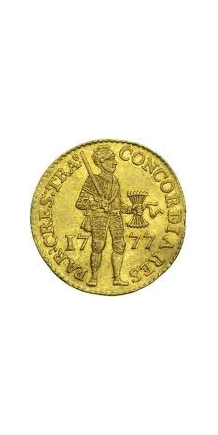
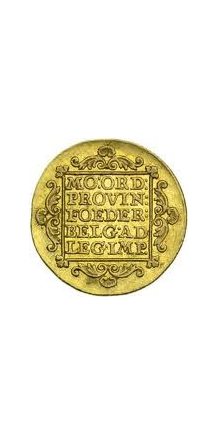
This graph plots the number of prices for gold, silver and for a number of coins.
All the main currencies quoted in Paris until 1936
Learn more